My Analytics, explained: how to read your score trend, accuracy, speed and weak modules
Where to find it
The Analytics tile on the home screen, or the My analytics button on any results screen. If you have not taken a test yet it says "No data yet" — one mock and it comes alive.

The four numbers at the top
- Mocks taken — every recorded attempt, of any size. (39 here: 8 full or module mocks plus unit practices and Daily 10s.)
- Qs answered — total questions you have actually answered. This is the number that predicts your result better than any other; 1,935 in three weeks is a serious pace.
- Overall accuracy — correct ÷ answered, across everything. It turns green at 60%. Do not chase it directly: it is a slow average of your whole history and moves last.
- Avg per question — seconds per question across all timed work. The exam allows 72.
Chart 1 — Score trend
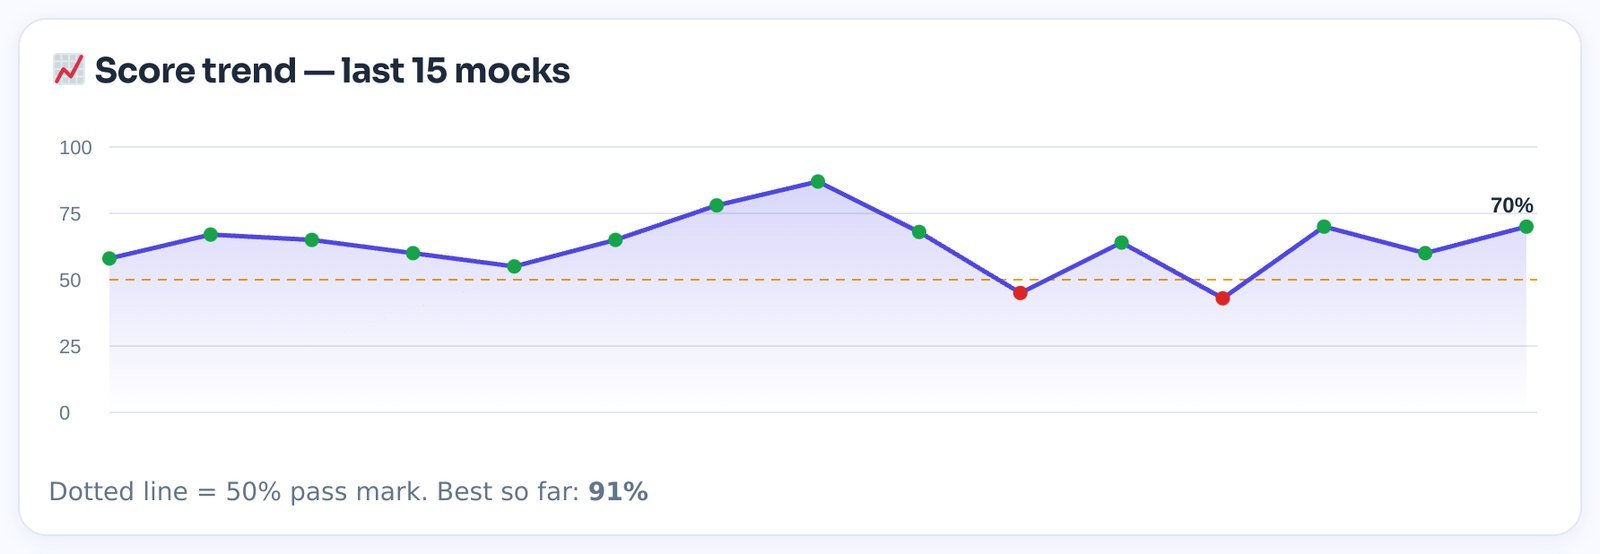
Each dot is one test, oldest on the left, with the dotted line at the 50% pass mark. Read the shape, not the dots:
- Climbing line — your plan is working. Keep it.
- Zig-zag — the dips are usually a new subject or Exam mode after a run of Learning mode. Look at which dots are red; in the sample, both red dots are PPB.
- Flat line — you are re-practising what you already know. Go to the weakest-modules list at the bottom of the page.
Note that unit practices count as tests here, so a long unit in a weak module can pull a dot down. That is information, not a problem.
Chart 2 — Accuracy by subject
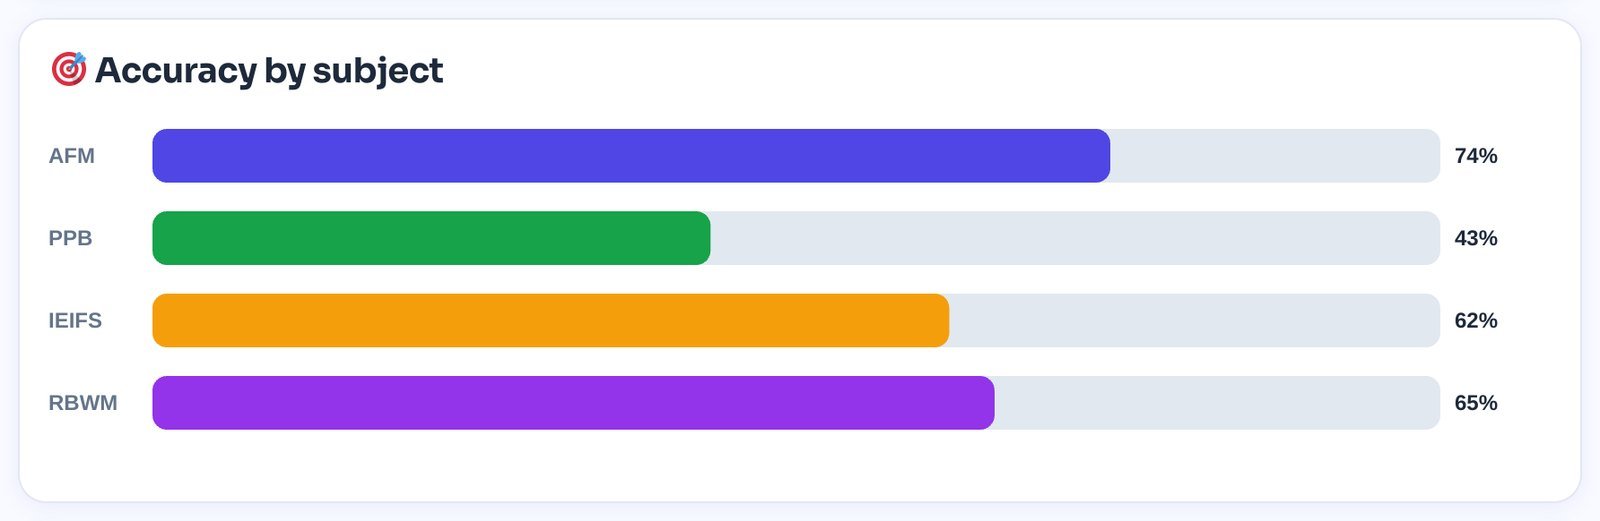
One bar per paper, all of your history. Two rules of thumb: anything under 50% is a subject you would fail today; anything over 65% is a subject you can maintain with revision alone. The gap between your best and worst bar tells you where next week's hours belong — in the sample, PPB is 31 points behind AFM, so AFM gets maintenance and PPB gets the work.
Chart 3 — Speed
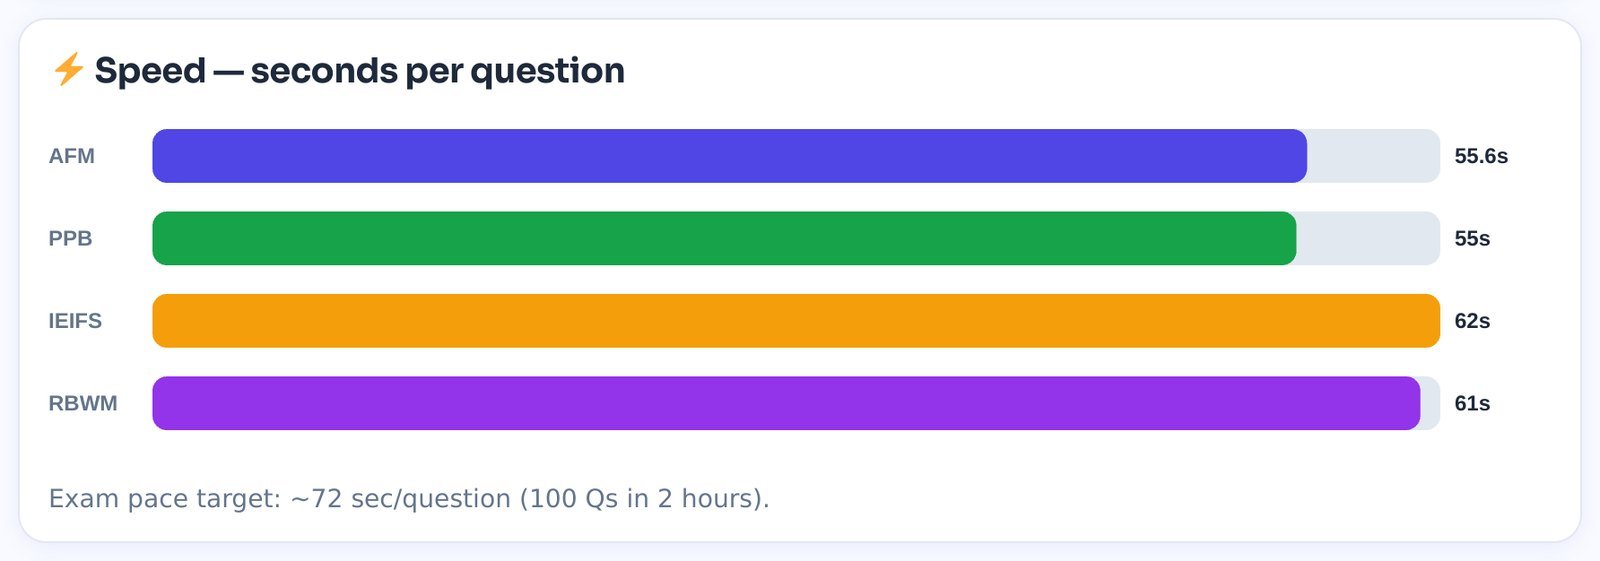
The exam gives you 120 minutes for 100 questions: 72 seconds each. Bars under 72 are fine. A subject over 72 means you will run out of time on that paper — usually because of numericals (AFM) or because you are re-reading long stems (PPB). Fix speed with Exam-mode mocks only; Learning mode is deliberately slow.
Chart 4 — Weakest modules, fix these first
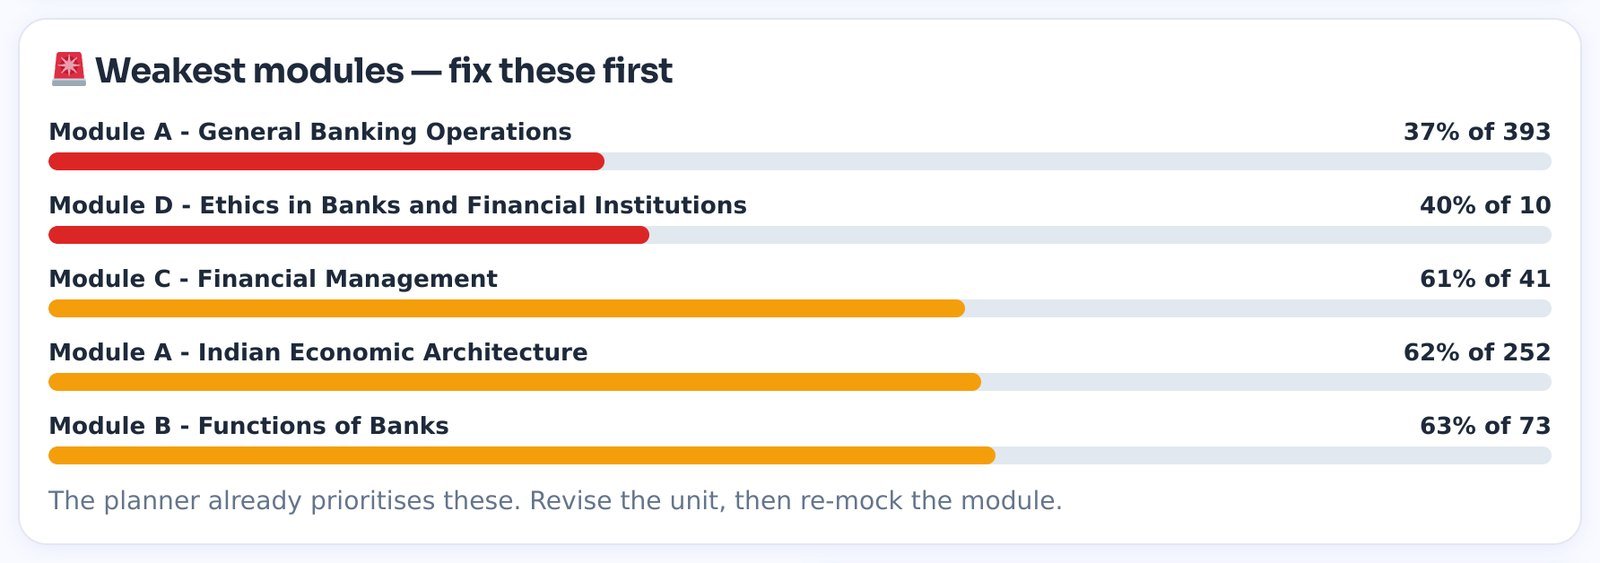
This is the most useful list in the app. Every module you have answered at least 8 questions in, sorted worst first, red under 60%. The "37% of 393" means 37% accuracy across 393 answered questions — a big sample, so the weakness is real. "40% of 10" is only ten questions: practise more before you worry.
The planner already prioritises these modules; the recommendation on the home screen uses the same data (any module under 45% triggers a "Fix" suggestion). What to do with a red module: watch its animated unit PPTs, run each unit in Learning mode, clear the revision it generates, then take the module mock in Exam mode. Come back here a week later and watch the bar turn amber.
The results screen — analytics for one mock
Every time you finish a test you get a results screen. It is the same analysis, zoomed in on one paper, and it is where most of your improvement decisions should be made.
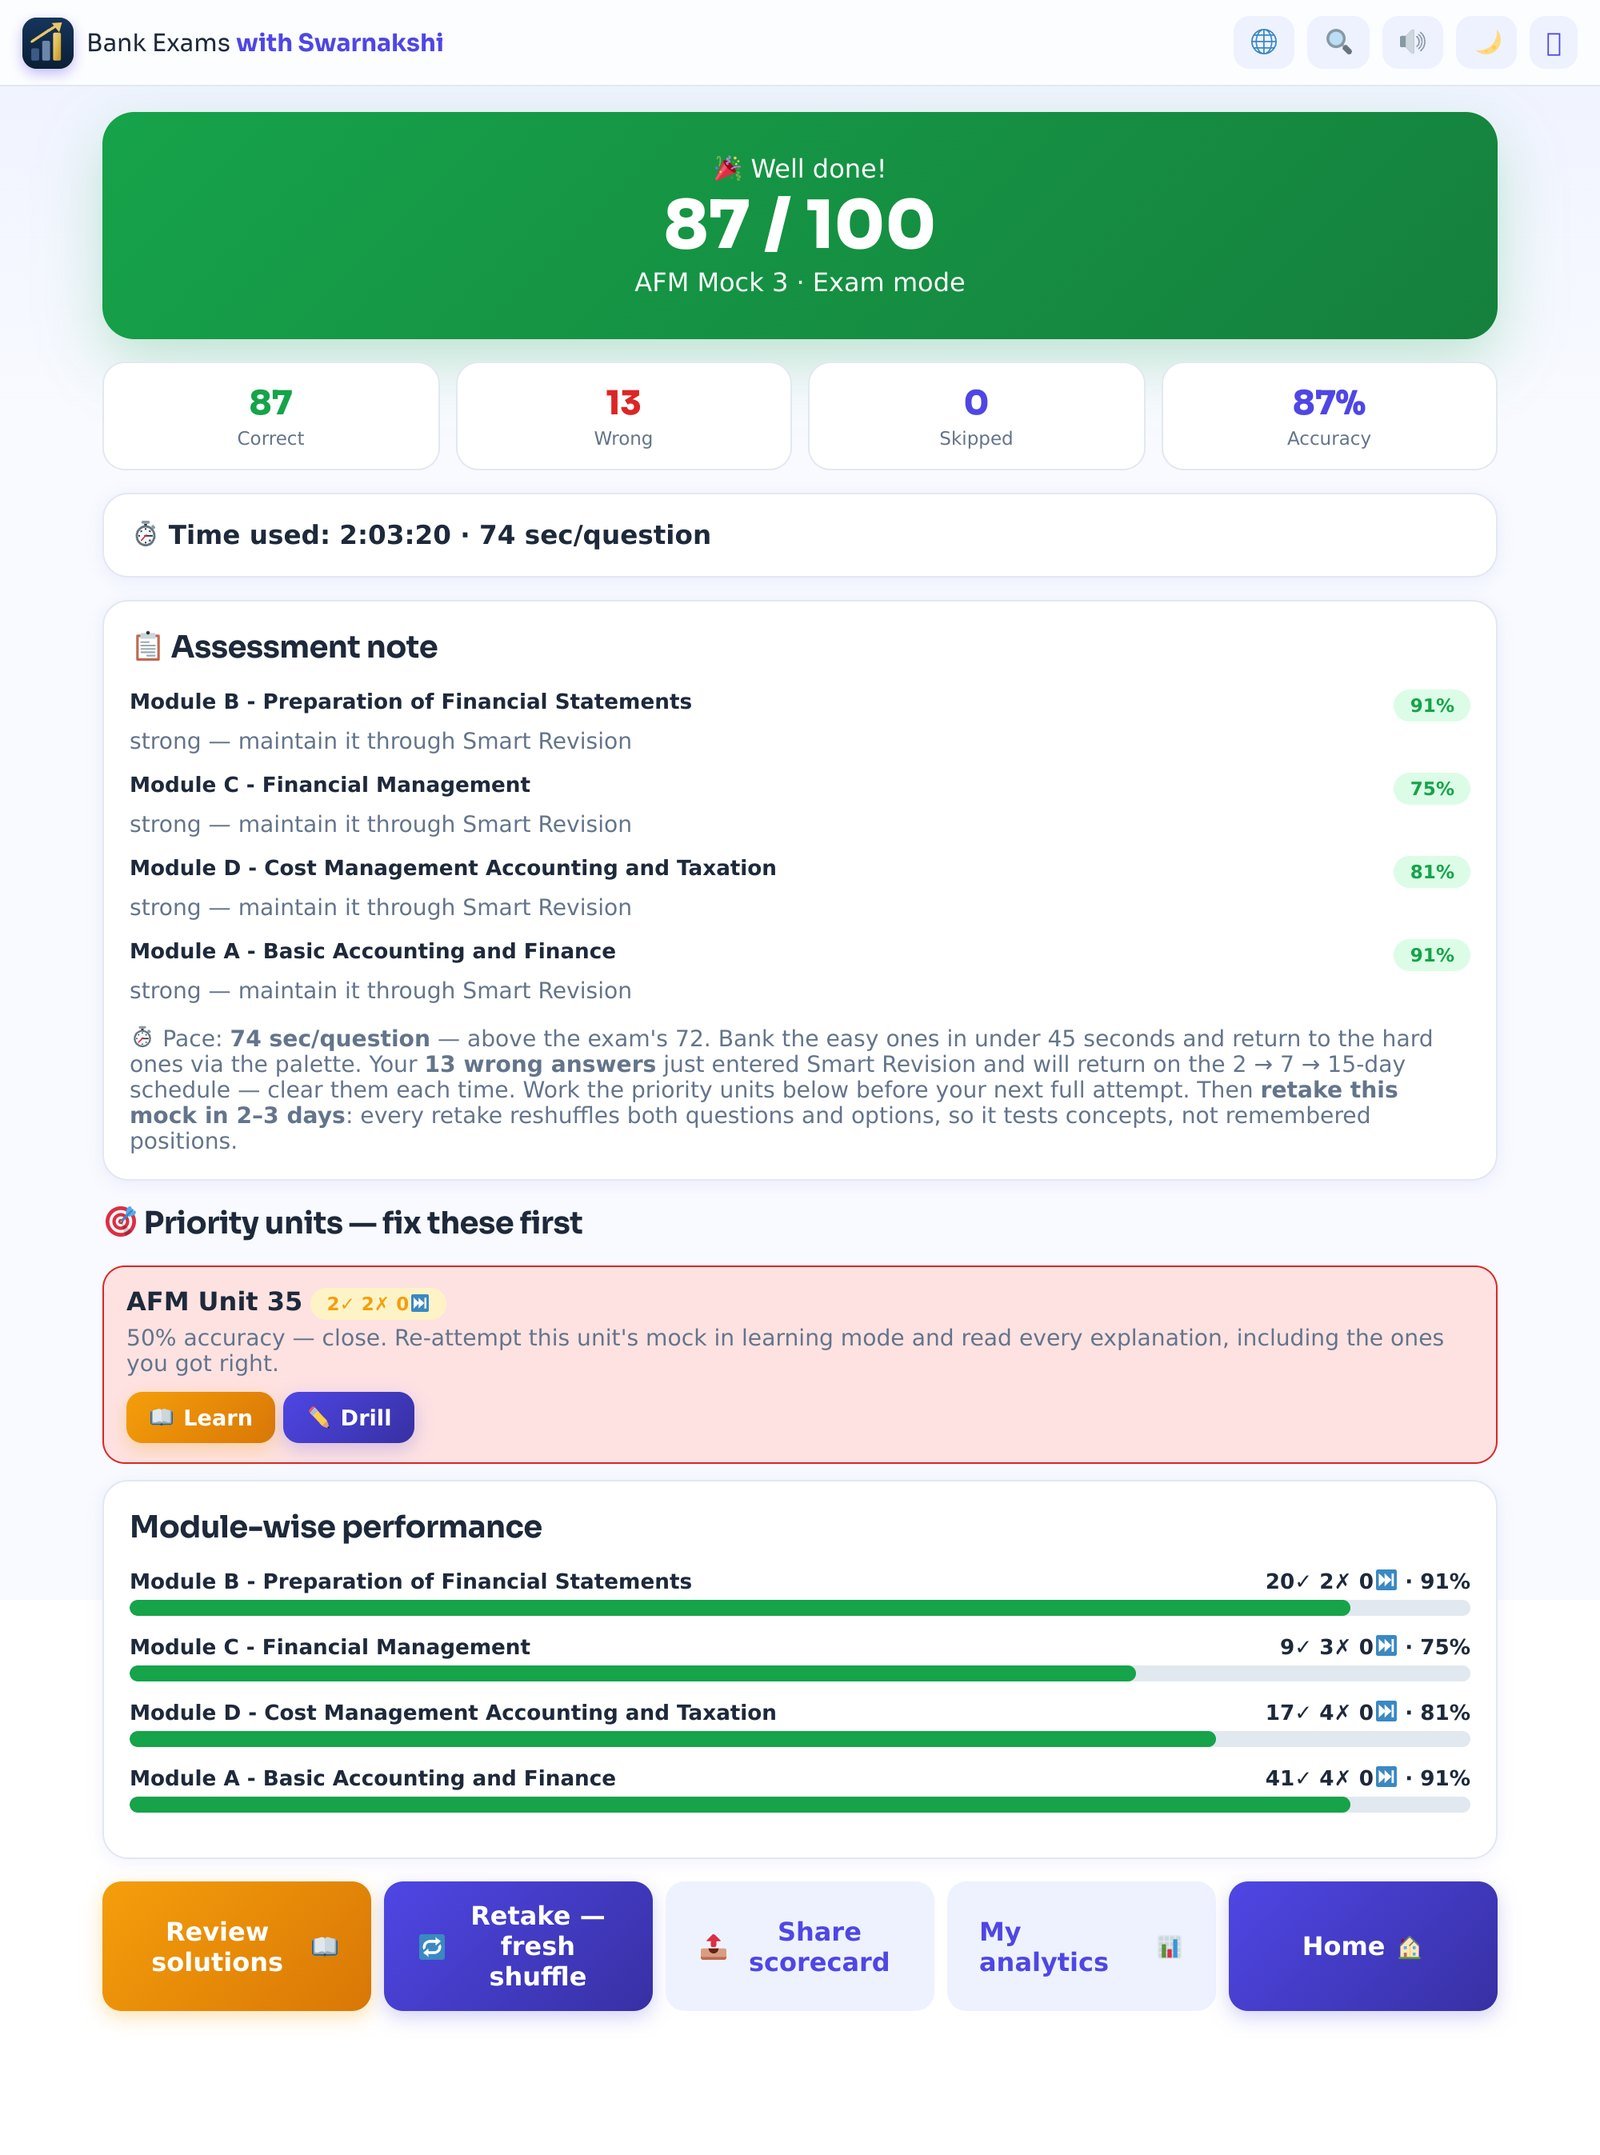
- Score, correct/wrong/skipped, accuracy, time used — the headline.
- Assessment note — one line per module: "strong — maintain it through Smart Revision", or a warning with the accuracy. Then a paragraph about your pace and what happened to your wrong answers (they entered Smart Revision on the 2 → 7 → 15-day schedule).
- Priority units — fix these first — the specific units that cost you marks in this paper, each with a Learn button (concept deck + Animated PPT) and a Drill button (that unit's questions).
- Module-wise performance — ✓ / ✗ / skipped counts and a percentage per module; anything under 60% is your revise-first list.
- Buttons — Review solutions (every question with its explanation), Retake — fresh shuffle (same mock, questions and options reshuffled, so it tests concepts rather than remembered positions), Share scorecard (a PNG you can send to a study group), My analytics, Home.
A ten-minute weekly review
Common questions
- Why does my Analytics accuracy differ from the Readiness card's accuracy?
- Analytics shows your whole history; Readiness uses only your last ~200 questions in each subject, because recent performance predicts the exam better. If Readiness is higher, you are improving.
- Do revision sessions and the Daily 10 count here?
- Yes — every attempt of every kind feeds the page. That is why the summary says "39 mocks" when you have taken 8 full ones.
- Can I export my data?
- The scorecard image after any mock is the shareable version. Your progress is also synced to the cloud, so it follows you across your two devices.
Screenshots show a sample student account after three weeks of practice; your numbers will be your own. Independent study aid — not affiliated with, endorsed by, or sponsored by IIBF. Readiness figures are estimates computed from your own practice inside the Mock Centre and do not predict the official result.